6/06/2010 @ 2:07 PM
Measurement
In this unit, you will learn about the pythagorean theorem and the perimeter/area/surface area/volume of shapes and 3-D objects.
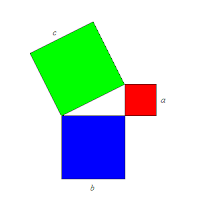
First, there is the pythagorean theorem.
The equation for the pythagorean theorem is a² + b² = c²
c² is the hypotenuse side.
EXAMPLE: Side a = 2 Side b = 8
What is the measure of side c?
a² + b² = c²
(2)² + (8)² = c²
4 + 64 = c²
68 = c²
68 squared = c² squared
8.2 = c
Another thing we learned about is perimeter and area.
Here are the equations:
Rectangle
Perimeter: P= l + l + w + w OR P = 2 (l + w)
Area: A = lw
Parallelogram
Perimeter: P = b + b + c + c OR P = 2 (b + c)
Area: A = bh
Triangle
Perimeter: P = a + b + c
Area: A = bh/2 OR 1/2bh
Trapezoid
Perimeter: P = a + b + c + d
Area: A = (a + b)h /2 OR 1/2 (a + b)h
Circle
Circumference: C = πd OR 2πr
Area: A = πr²
Cylinder
Surface Area: SA=2πr²+2πrh
Volume: V=πr²h
Sphere
Surface Area: SA=4πr²
Volume: V=4/3 πr³
Cone
Surface Area: SA=πrs+πr²
Volume: V=1/3 πr²h
Square base pyramidArea: A=2bs+b²
Volume: V=1/3 b²h
Rectangular prism
Area: A=2(wh+lw+lh)
Volume: V=lhw
Triangular prism
Area: A=ah+bh+ch+bl
Volume: V=1/2 blh
PRACTICE:
1)
 What is the perimeter of this triangle? What is the perimeter of this triangle?
ANSWER: P = 9 + 5 + 11
P = 25
2) What is the area of a rectangle that has a length of 12m and a width of 4m?
ANSWER: A = lw
A = (12) (4)
A = 48m
3) Soda is sold in aluminum cans that measure 15cm in height and 6cm in diameter. What is the volume?
ANSWER: V=πr²h
V = (3.14)3² (15)
V = (3.14)9 (15)
V = 423.9 cm³
4)
Find the volume of this triangular prism.
V=1/2 blh
V= 1/2 (6.2) (4.3) (8.5)
V= 1/2 (226.61)
V= 113.30cm³
Another thing we learned about is the angle relationships in triangles.
The sum of the interior angles in a triangle is 180 degrees. Therefore, a + b + c = 180 degrees.
The sum of the exterior angles of a triangle is 360 degrees. Therefore, x + y + z = 360 degrees.
The exterior angle of each v ertex is equal to the sum of the two opposite interior angles, so x = b + c, y = a + c, and z = a + b. EAT (Exterior angle theorem)
A midpoint is a point that divides a line in half EQUALLY.
TIP: the formula for the sum of the interior angles of a regular polygon is 180 (n-2)
In any quadrilateral, when you connect the midpoints of the sides, a parallelogram/rhombus is formed.
Labels: Lessons
back to the top.
@ 2:07 PM
Analytic Geometry
In this unit, we learned about rearranging an equation in standard form to slope y- intercept form, rearranging an equation in slope y-intercept form to standard form, angle relationships in triangles, quadrilaterals, and polygons, how to find the midpoints and medians in triangles and quadrilaterals, graphing using x and y intercepts, parallel and perpendicular lines, and finding equations of lines given the slope and a point.
First, we learned about rearranging an equation in standard form to slope y-intercept form.
It is more useful to write an equation in slope y-intercept form, since slope y-intercept has more info, and it easier to graph.
To rearrange a standard form equation to a slope y-intercept, we isolate the y-term on one side of the equation, so it looks like: y= mx + b.
EXAMPLE: Ax + By + C = 0
By = -Ax - C
If the coefficient is something like '3y', then divide each term by the coefficient next to y.
EXAMPLE: 6x + 3y + 9 = 0
3y = -6x - 9
3y/3 = -6x/3 - 9/3
y = -2x -3
We also learned how to do the opposite- rearranging an equation in slope y-intercept form to standard form.
To do this, we rearrange the terms to the left hand side of the equation, so it looks like this: Ax + By + C = 0
Then, on the right side, you just put a 0. Simple, right?
TIP: If the 'A' term is negative, divide all the terms by -1.
If there are fractions, then multiply each term by the lowest common denominator (LCD) to remove the fractions.
EXAMPLE: y = 2x -5
-2x + y + 5 = 0
-2x/-1 + y/-1 + 5/-1 = 0
2x - y - 5 = 0
Also, we learned about parallel and perpendicular lines. Parallel lines are lines that run in the same direction- they never cross!
For parallel lines, the slopes are equal. For example,
y = 3x + 5
y = 3x - 2
Perpendicular lines, on the other hand, are lines that intersect at right angles.
For perpendicular lines, the slopes are negative recriprocals.
EXAMPLE: 3/7 => -7/3
-2/3 => 3/2
Questions:
Rearrange the equation in standard form to slope y-intercept form.
1) 4x + 2y -6 =0
ANSWER: 2y = -4x + 6
2y/2 = -4x/2 + 6/2
y = -2x + 3
2) 9x - 3y - 6 = 0
ANSWER: -3y = -9x + 6
-3y/-3 = -9x/-3 + 6/-3
y = 3x -2
3) 8x - 4y + 16 = 0
ANSWER: -4y = -8x - 16
-4y/-4 = -8x/-4 - 16/-4
y = 2x - (-4)
y = 2x + 4
4) -12x + 2y - 18 = 0
ANSWER: 2y = 12x + 18
2y/2 = 12x/2 + 18/2
y = 6x + 9
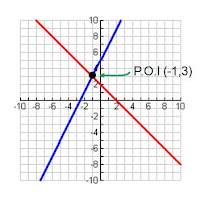 Another thing we learned was linear systems. To solve linear systems, you need a POI, or point of intersection. Those points must satisfy the equation. An example is shown at the right.
-------------------------
Rearrange the equation in slope y-intercept form to standard form.
1) y = 3x - 6
ANSWER: -3x +y + 6 = 0
-3x/-3 + y/-3 + 6/-3 = 0/-3
x + y/-3 -2 = 0
2) 3y = 6x + 12
ANSWER: -6x + 3y -12 = 0
-6x/-6 + 3y/-6 - 12/-6 = 0/-6
x + 3y/-6 - (-2) = 0
x + 3y/-6 + 2 = 0
3) 2/3y = -1/6x + 4
ANSWER: 1/6x + 2/3y - 4 = 0
1/6x (6) + 2/3y (6) + 4 (6) = 0 (6)
x + 4y - 24 = 0
4) Real Life Scenario:
The grad committe is hosting a graduation party, and they are renting a hall at the Showcase Hall. The Showcase hall uses the equation 10n - C + 1300 = 0 to determine the cost for a hall rental.
C represents cost, in dollars
n represents the number of people attending the graduation party.
i) Rearrange the equation into slope y-intercept form.
10n - C + 1500 = 0
-C = -10n - 1500
-C/-1 = -10n/-1 - 1500/-1
C = 10n + 1500
ii) What is the rental cost if 120 people attend the graduation party?
C = 10n + 1500
C = 10 (120) + 1500
C = 1200 + 1500
C = 2700
Therefore it would cost $2700 to rent the Showcase Hall for 120 people. Labels: Lessons
back to the top.
@ 2:05 PM
Linear Relations
In this unit, you will learn about slope, slope as a rate of change, direct variation, and partial variation.
First, we learned about slope. Slope is the steepness of a line, and it is measured by its slope. The slope of the straight line is the ratio of the rise to the run between both points.
The equation for slope is m = rise/run (rise over run), where m is slope.
The picture above shows an example of slope. To find the slope of a line, you find two points on the line, and imagine a triangle. Then, depending on how you think, you would move 2 times to the right, since the formula is m = rise/run. After that, you do the same thing, but move upwards 4 times instead of moving right, since we are trying to find the slope. Rise = 4 Run = 2 m = rise/run m = 4/2 m = 2/1
The run is horizontal (x-axis), and the rise is vertical (y-axis).
If the line is moving upwards/increasing, the slope is positive. If the line is moving downwards/decreasing, the slope is negative.
TIP: In some cases, the line is a straight line with no rise or no run. If the rise is 0 and the run is a #, the slope is always 0. EXAMPLE: 0/# If the rise is a # and the run is 0, the slope is undefined. EXAMPLE: #/0
Therefore, horizontal lines have a slope of 0 (no rise), and vertical lines have a slope that is undefined (no run, cannot divide by zero). Another thing we learned was slope as a rate of change. A rate of change compares the change in one quantity relative to a change in another quantity.
Unlike slope, though, a rate of change is expressed in units! For example, km/h.
Basically, slope and rate of change are the same thing.
 The formula for rate of change is the change in dependent variable divided by the change in independent variable. So, the formula would be y2 - y1/ x2 - x1.
EXAMPLES: Loujain runs 25 km in 5 hours. What is her speed?
= 25/5
=5km/h
Sarah has a race with Sohyun. Sarah ran 30km in 3 hours, and Sohyun ran 36km in 6 hours. Who ran more?
Sarah- =30/3
=10 km/h
Sohyun- = 36/6
= 6 km/h
Sarah ran more.
Direct variation is the relationship between 2 variables in which one variable is a constant multiple of the other. Some characteristics of direct variation is how the graph will always be linear (straight line), the graph will always intercept the y-axis at the origin, and the equation for direct variation is always y = mx.
EXAMPLE: y=2x
D=5t
C=25h
H=10t
Partial variation is when the relationship between two variables have both a fixed and variable amount. Some characteristics of partial variation is how the fixed variable does not change- although the variable value changes, the graph intersects below or above the y-axis, the equation is always y = mx + b, and the line on a partial variation graph never passes through the origin.
EXAMPLE: C = 2.00 + 0.50n
T = 232 + 3n
y = 3.5x + 3
y = 0.2x + 5
TIP: the m (slope) and b (fixed cost) are constants.
m represents the constant of variation (multiple).
b represents the fixed, initial value.
Labels: Lessons
back to the top.
6/05/2010 @ 8:12 PM
Equations
In this unit, you will learn about solving simple equations, multi-step equations, equations with fractions, and modeling with algebra/formulas.
Simple equations are usually straightforward, and not very hard.
TIP: Equations and expressions are NOT alike!
Expression: a²b² + 3ab -1
Equation: x² - 3xy = 2
Equations have equal signs!
To "solve" means to find the value of the variables that makes the equation true. There are 2 ways of doing this, and the first way is solving by inspection.
Basically, what you do is solve for the missing variable- you can even eyeball the answer! (Eyeball- just look over and guess what the answer is- common sense)
EXAMPLE: x + 12 = 19
x = 7
The second way of solving an equation is solving by isolation. This is the way most people take, since it lets you check your answers with a LS/RS check.
What you do is isolate the variable on one side of the equation by using opposite operations.
 EXAMPLE: y + 12 = 23
y= 23 - 12
y= 11 EXAMPLE: y + 12 = 23
y= 23 - 12
y= 11
TIP: Remember to do LS = RS check! For example: y + 12 = 23, y = 11
SAMDEB
SAMDEB is actually BEDMAS backwards! Since we use opposite operations while solving equations, we use SAMDEB instead.
To use it, you first get rid of the constant term on the same side of variable with subtraction/addition, then you isolate the variable by multiplying/dividing the coefficient.
We also learned how to solve multi-step equations. These equations usually have more than one variable, usually 2. What you do is collect the variable terms on one side, and the constant terms on the other side.
EX AMPLE: 13x – 5 = 10x + 7
13x - 10x = 7 + 5
3x = 12
3x/3 = 12/3
x = 4
QUESTIONS:
Solve each equation:
1) x + 6 = 2x – 8
ANSWER: 6 + 8 = 2x -x
14 = x
2) 4(x – 2) = 12
ANSWER: 4x -8 = 12
4x = 12 + 8
4x = 20
4x/4 = 20/4
x = 5
3) 6(2x – 5) = 4x + 2
ANSWER: 12x - 30 = 4x + 2
12x - 4x = 2 + 30
8x = 32
8x/8 = 32/8
x = 4Labels: Lessons
back to the top.
6/03/2010 @ 9:39 PM
Relations
In this unit, you will mostly learn about scatter plots. Also, you will learn about the line/curve of best fit, linear/non-linear relationships, different trends in data, first differences, distance-time graphs, and the scientific process.
First, let's look at the scientific process. The process is as follows:
1) Write a hypothesis
2) Perform an experiment
3) Collect data
4) Organize data (spreadsheet, table of values)
5) Display data (scatter plot, graphs)
6) Analyze data (look for trends/relationships)
7) Conclusion- state if your hypothesis was true or not
Basically, all this means is you make a hypothesis, perform an experiment, get all the data, and come to a conclusion with the data you have.
EXAMPLE: Drivers' age VS risk of car accident
As the drivers' age increases, the risk of car accidents increases.
As the drivers' age increases, the risk of car accidents do not increase.
Hours studying VS final grade
As the hours studying decreases, the final grade will decrease.
As the hours studying decreases, the final grade will not decrease.
EXAMPLES OF: Primary Data & Secondary Data
-I go around to all the grade 9 classrooms asking for their favourite colour out of the two- red or blue. (PRIMARY)
-I go on Statistics Canada and search up how many deaths were reported in Canada in 2005. (SECONDARY)
Another thing we learned about was scatter plots. Scatter plots show the relation between two variables.
An example of a scatter plot graph is -HERE-
A scatterplot has the independent variable on the x-axis, and the dependent variable on the y-axis.
For example, the number of classes missed as an impact upon one's final grade. Since the independent variable is the number of classes missed, it is displayed on the x-axis, while the final grade is displayed on the y-axis (because it depends on the number of classes missed).
On a scatterplot, there is usually a line of best fit. It shows a trend or pattern on a scatterplot, and it is used to make predictions.
A few tips when drawing the line of best fit:
- Line follows Trend
- Goes through as many points as possible
- There are an equal number of points above and below the line
- It can be used to predict.
When a scatterplot has a non-linear relation, it is not possible to use a line of best fit- so instead, we use a curve of best fit. It is basically a curve that has the same properties as the line of best fit- but curved.
Scatter plots have 3 main correlations, and they are: - Positive Correlation- increasing to the right
- Negative Correlation- decreasing down to the right
- No correlation- no pattern
If you want to be more specific, you can add "strong" or "weak" correlation.
- Positive Strong Correlation/Strong Positive Correlation- Data strongly increases to the right
- Positive Weak Correlation/Weak Positive Correlation- Data weakly increases to the right
- Negative Strong Correlation/Strong Negative Correlation- Data strongly decreases to the right
- Negative Weak Correlation/Weak Negative Correlation- Data weakly decreases to the right
Of course, no correlation is just left as it is.
 First Differences are the increases/decreases in the y-values in a table. They represent the change in y.
TIP: The x-values must go up by 1- consecutive values. First Differences are the increases/decreases in the y-values in a table. They represent the change in y.
TIP: The x-values must go up by 1- consecutive values.
How to calculate first differences:
-Subtract the y-values from the bottom-up
-Can be from top to bottom, or bottom to top
<---Example
Therefore, the first difference is (-2).
TIP: First differences is also the slope.
Since first differences are used to find if a relation is linear/non-linear,
the example shows that the relation is linear.
If the first differences do not match up/are constant, the relation is non-linear.
TIP: For first differences, a positive first difference means a positive correlation, and a negative first difference means a negative correlation.
As well as that, we learned about distance-time graphs.
The distance you travel depends on how long you've been traveling for.
So, distance is put on the y-axis and time is put on the x-axis.
The equations for distance time graphs are as follows:
EXAMPLES:
A snail can move approximately 0.30 meters per minute. How many meters can the snail cover in
15 minutes?
ANSWER: D = speed x time
D = 0.30 (15)
D = 4.5m
May drives 150 km in 5 hours. What is her speed?
ANSWER: Speed = d/t
S = 150 / 5
S = 30km/hr
How long did it take Mayu to run 40km in an average of 4km/h?
ANSWER: T = d/s
T = 40/4
T = 10 hours
An example of a distance-time graph:
Labels: Lessons
back to the top.
6/02/2010 @ 10:36 PM
Helpful Tips
Divisibility Rules
A number is divisible by:
-2 if the number is even
-3 if the sum of its digits is divisible by 3
-4 if the number represented by the last 2 digits is divisible by 4
-5 if the last digit is 0 or 5
-6 if the number is divisible by 2 and 3
-8 if the number represented by the last 3 digits is divisible by 8
-9 if the sum of the digits is divisible by 9
-10 if the last digit is 0
Integer Tip
-8² = (-64)
(-8)² = (+64) ---> (-8) x (-8) = (+64)
When a number has an exponent with it, if the exponent is even, the result is positive.
If the exponent is odd, the result is negative.
EX.
(-3) ³ --> (-3) x (-3) x (-3) = (-27)
² ---------- Labels: Lessons
back to the top.
6/01/2010 @ 11:27 PM
Polynomials
In this unit, we learned about polynomials, exponent laws, terms, distributive property,
There are 5 exponent laws, and they are:
 Multiplication Multiplication
Division Power Law Power of a Product Power of a Quotient *Remember, these rules/laws only apply to multiplication and division problems! So these laws cannot be used with addition and subtraction problems.
*Also, the bases must be the same for the laws to work!
EXAMPLE: 3 ² x 3² = 3^4
Definitions for this unit are found on the sidebar or -HERE-
Also, we learned about coefficients and variables. The coefficient is the number, and the variable is.. well, the variable and/or exponent. For example, k² - the coefficient is 1 (invisible 1 in front of variable) and the variable is k² .
There are different types of polynomials, so to seperate them, we find the degree.
The degree is the sum of exponents on the variables in a term.
If the term is x², the sum of the exponents is 2, so the degree is therefore 2.
If the term is 3x²y, the sum of the exponents is 3, so the degree is therefore 3.
TIP: if the term is -4, the sum of the exponents is 0, so the degree is 0 as well.
Do you see the pattern? So technically the sum of the exponents in the polynomial is the degree.
TIP: The degree of a polynomial is the degree of the highest degree term!
If we look at polynomials, the term with the highest degree will be the degree of the polynomial! For example, if the polynomial is x + 4, the term with the highest degree would be x, and the degree would be first.
If the polynomial is 5x² - 7x, the term with the highest degree is 5x², and the degree of the polynomial would be second, and so on and so on.
TIP: For terms to be alike, they have to have exact variables and exponents, but the coefficients can be different- like 4xy and 3yx.
We also learned about collecting like terms. To collect like terms, simplify the polynomial by adding or subtracting like terms. ONLY add/subtract coefficients! The variables and exponents stay the same!
As well as that, we learned how to add and subtract polynomials, and the distributive property.
To add polynomials, you remove the brackets and collect like terms.
EXAMPLE: (a² - 7a + 4) + (-5a² + 8a + 5)
= a² + 7a + 4 + (-5a²) + 8a + 5
= a² - 7a + 4 - 5a² + 8a + 5
= -4a² + a + 9
Also, we learned how to subtract polynomials. To do this, you would add the opposite polynomial.
EXAMPLE : (3x² + 2) - (5x² + 6)
= (3x² + 2) + (-5x²) - 6 <-- What you do is make every sign on the other side of brackets become the opposite of what it already is- so 3x would be (-3x), -x² would be x², etc. Remember to change the sign in the middle too, or else it will not work!
= 3x² + 2 + (-5x²) - 6
= -2x² -4
Distributive property is something we also learned. Distributive property is used to get rid of brackets in an equation/expression. Any number in front of a bunch of numbers/variables must be multiplied together!
An example would be 2 (x + y). Since brackets usually mean multiplication, multiply them!
So it would be:
2 (x + y)
=2x + 2y
So, 2 (x + y) = 2x + 2y! (This is because they are equal to one another.)
Another example would be: -7 (n-5) + 7 (2n +3)
To solve it, you need to use proper BEDMAS, so multiplication first, then everything else.
-7 (n-5) + 7 (2n +3)
= -7n + 30 + 14n + 21
= 7n + 51
An even trickier question would be this: (x + y) + (2x + 3y)
Since it is x multiplied by x, it would be x².
So,
(x + y) + (2x + 3y)
= 2x² + 3y²
^ This one is trickier because of the exponents, but remember, practice makes perfect!
PRACTICE:
Use the exponent laws.
Answers in RED.
Labels: Lessons
back to the top.
|
description
Hello, my name is Sohyun Kim, and I am in grade 9. This site is for my math summative project, so no hateful comments please. I generally like to read, draw, read manga, and watch anime in my spare time.
Normal | Bold | Strikeout | Italic | Underline | Link | big | small
definitions.
Polynomials: Algebraic expressions made up of terms
Monomial: 1 term
Binomial: 2 terms
Trinomial: 3 terms
Terms: Made up of a coefficient and variable(s)
Power: Product of identical factors and consists of 2 parts- exponent and base.
Coefficient: ----
Variable: ----
Constant/constant term: A term with no variable
Hypothesis: A theory or statement that is either true or false
Statistics: The collection, organization, and analysis of numerical data
Primary Data: Data that comes from experiments and surveys done by researchers
Secondary Data: Data that already exists- comes from sources such as the internet, magazines, and Statistics Canada
Interpolation: Prediction involving a point within the set of data
Extrapolation: Prediction involving a point outside the set of data
Linear Relation: Relation between 2 variables, forms a straight line
Non-Linear Relation: Relation between 2 variables, does NOT form a straight line
Curve of best fit: Curve that comes closest to the points of a non-linear relation
First Differences: -----
Slope: The steepness of a line- ratio of the rise to the run between both points
Direct Variation: A relationship between 2 variables in which one variable is a constant multiple of the other
Partial Variation: When a relationship between 2 variables have both a fixed and variable amount
Continued -HERE-
|

 What is the perimeter of this triangle?
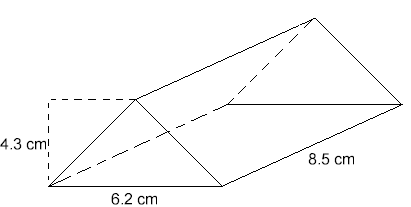


